
Fluentd, experience in production
Reading Time: 6 minutesUnified logging systems are increasingly being used to handle the logs from all across the platforms and the applications. These systems are becoming even more important in a cloud scenario where heterogeneous applications of any kind are used to solve the business problems at scale. This article addresses an analysis of one of these unified logging systems, Fluentd, running in real experience at scale level.
Fluentd is an open source data collector for unified logging layer.
fluentd.com
Fluentd allows you to unify data collection and consumption for better use and understanding of data. This software is licensed under the terms of the Apache License v2.0, which first commit was done on June 18 2011 and it’s a graduated project, since April 2019, of the Cloud Native and Computing Foundation starting its journey on November 2019. To reach the maintainers and the open-source community behind the project can be found in the Fluentd Slack channel and the Github project.
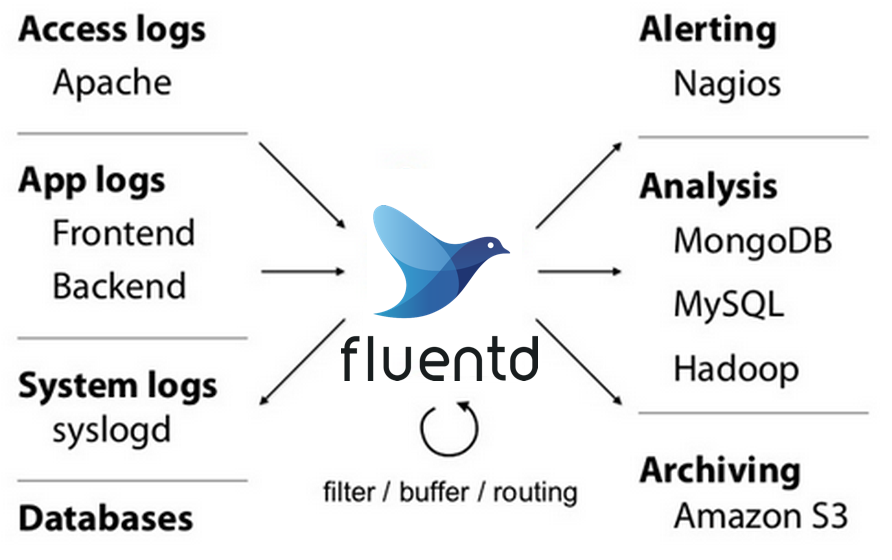
Basically, Fluentd is an application that is able to ingest information from many different sources, perform filters and other actions, and route the output to different targets. This service relies its strength on the amount of input, output, filter, and parser plugins of any kind which expands its functionality beyond the initial limits and uses cases. The principal use case for Fluentd relates to system, platform, and application logs, as is indicated in the use cases official web page.
The experience
A project that is part of the CNCF commonly provides official Kubernetes resources so the companies and open-source community are able to deploy the software in the different cloud providers, such as Azure, AWS, or Google Cloud. This is the case of Fluentd too and the official documentation page provides a high-level description about how to deploy Fluentd on Kubernetes. There is not much articles and analysis done about the current confidence that the companies have about Kubernetes so just high-level documentation might not be enough to leverage the trust on a system at scale. Fortunately, the Fluentd community provides stable HELM Charts that help during the management of any cloud application deliverable on Kubernetes.
A keystone service running into a system must be ready to scale. Besides this, another approach is to be ready, from the beginning, to absorb the expected load so, following this idea, we could deploy 3 pods by default. Not only 1, because it could be a single point of failure and not 2 because it might not be enough to handle “production load” for any system. Based on the specific use case, it could make sense to deploy even more pods from the scratch and this open question will be answered using the observability of the Fluentd deployment.
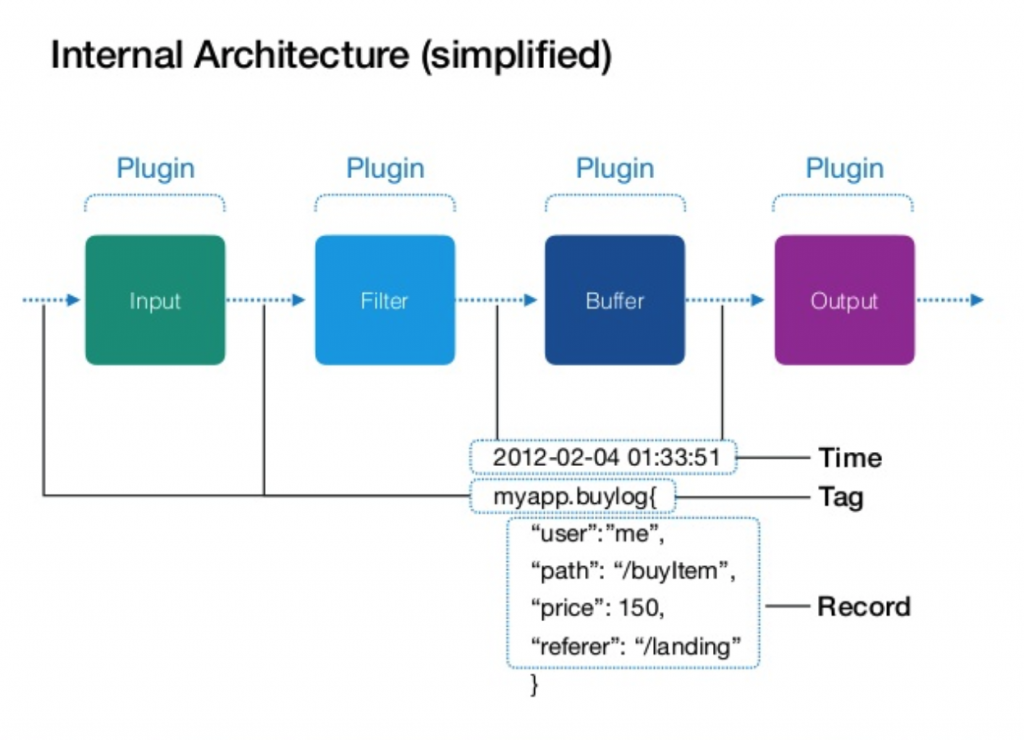
One of the complicated parts of the Fluentd is to handle the configuration of all events defined by the input, output, filter, etc, which plugins are linked via matches. The “Hello World” use case comes with one single input (HTTP, why not?) and one single output (STDOUT, for example). The Fluentd configuration is based on the fluentd.conf file, that lives in the /etc/fluentd directory, and the syntax is a mix between XML and a properties file. Using Fluentd at scale comes with more complexity in the configuration because most probably Fluentd will be used by many data sources to different targets, and not just one-to-one. From an inquiry via Twitter, opened during 7 days with the interest of 8 participants which answered the question “Is it the @fluentd configuration complicated to manage at scale (production)?“, the results can be found in table 1.
| Yes | No | Never used at scale |
| 37,5% | 50% | 12,5% |
Another important topic to take into account when Fluentd is considered for a use case is the data format allowed to flow into the events. By default, the data to flow through Fluentd will pass in JSON format but also allows msgpack format, in case you need to send binary data across a Fluentd system. Besides CSV, HTML and WMS are the most common formats to share information, JSON is the facto standard that would help you in most of the use cases, moreover, if yours matches with the ones of those that fit Fluentd’s design. If your use case involves binary data, maybe mspack is not the format you are already using but protobuf, at least if the trend in Google is taken into account. In such a case you have to use some special treatment with the data, such as encode the data to base64 before to reach Fluentd and decode it afterward, which can be considered a dirty trick. As was mentioned before, the open-source community is always willing to help and is very committed to Fluentd project, so you could find some plugin to elegant bypass the special parts (there is always) of your use cases to fit with Fluentd.
Observability is one of the most important topics for any kind of production (and stagging) system and it’s composed for many factors, among which logging, tracing, and metrics can be highlighted. About the logging information, displayed in the STDOUT for a container-based deployment, Fluentd could be considered not the most verbose system. The INFO level just logs the content of the configuration file just when the pod starts, masking sensitive information of course, and the status of the service. When the data is flowing through the Fluentd, the logging system does not display too much information and it remains in a kind of silence mode until some WARN or ERROR happens, include stack trace in some cases. This can be considered as something good because not much space is used to store the log information but could bring some lack of confidence about the proper motion of the Fluentd. Regarding the tracing within Fluentd, the logging system offers TRACE mode and, at the time of writing this article, there is no confirmation that Fluentd could work with some external tracing tools, such as Jaeger. Prometheus is one of the top-ranked monitoring systems in the market and most probably the defacto election when we speak about open-source monitoring systems in the Cloud Native world. That’s why it could be considered a smart movement, from Fluentd community, providing the capability to expose Fluentd metrics in Prometheus format.
Performance
Passing from a staging or pre-production environment to real life is a huge step, and not all teams are ready for that, for many reasons. One of those reasons is the difficulty of reproducing production conditions in a controlled environment. This means that, when the production environment is up-and-running, the observability is key (again) for getting notice about the configuration changes that a deployment might need for being really ready. You will have different <match> sections of different types and each of them can be tuned using several parameters. However, there are some main points where and engineer can act and adapt a Fluentd deployment for making it scalable. You should read very carefully this Buffer configuration documentation, and the Performance Tunning article, to find the proper values that you have to set, based on the kind of traffic that is flowing through the Fluentd system. You will not find a magic recipe on this article, but from the experience, you will find that the buffer configuration is key for any environment at scale.
Production environments are in constant adaptation, based on the performance extracted from the observability. Following the same principle, you should expect another article dedicate to Fluentd performance in the near future.
Summary
In any use case, there are always special parts that could fit perfectly in the use case of a certain technology, like Fluentd, and this is fact from the experience pushing systems into production across several years. This means there is no need to worry if something does not fit perfectly, because it will not, but maybe it can be adapted somehow.
“One of the basic rules of the universe is that nothing is perfect. Perfection simply doesn’t exist…..Without imperfection, neither you nor I would exist”
Stephen Hawking
Fluentd is really good to route log information from different sources to several targets, and it can be lightly adapted, via plugins and thanks to the open-source community, to expand default use cases bringing a lot of functionality and flexibility to your on-premise or cloud systems as a whole. I would definitely encourage you to give it a try for your next project.